Bias is a bit of an ugly word, isn’t it? It certainly has become one of those battle phrases in the culture war, where both sides of the argument accuse the other of forcing their biases onto society. Board game reviews frequently need to justify themselves for their biases affecting their views. Dan Thurot recently wrote a very eloquent piece on the matter, diving deeper into different kinds of biases.
But bias also has a well defined meaning in statistics. Moving from emotions to cold hard numbers, the word bias loses its antagonistic nature and simply becomes a measurement one might want to minimise or remove entirely. Hence, debiasing the BoardGameGeek (BGG) ranking is about asking the question what it would look like if we removed the influence of a particular parameter. One such parameter is a game’s age: we’ve seen in the previous article that ratings have gone up over time, so removing the age bias from the BGG ranking means correcting for this trend.
This is by no means a new idea: Dinesh Vatvani published an often referenced article back in 2018 focussing on removing the complexity bias from the ratings. This article is an update to and an extension of his work.
Removing the age bias
So, let’s start with the bias readers of this blog will already be familar with: age bias, which really is just a slightly more neutral term for cult of the new. The first step is plotting the games’ ages vs their average ratings:
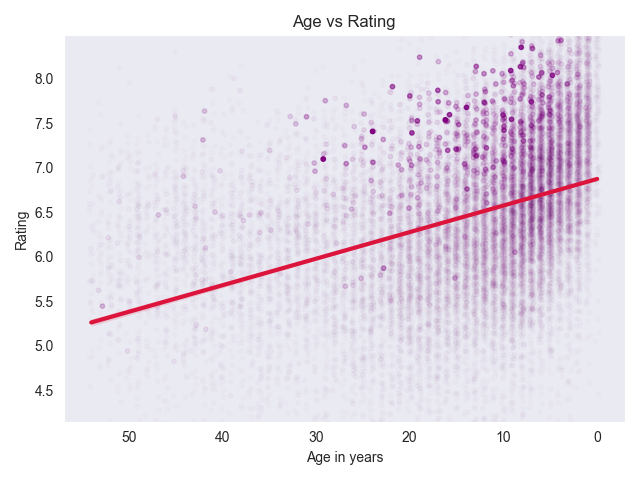
The points on the very left are the oldest games in our dataset, those published in 1970, whilst the ones on the right are those published in 2024. I’ve plotted games with few ratings more faintly in order to declutter the image. The bold red line is the line of best fit, i.e., the trend line that best describes the yearly increase in average ratings. This picture should look pretty familiar if you’ve read the previous article, though here we plotted every single game as an individual dot instead of aggregating by year.
That trend line has a slope of 0.03, which means that overall, a game’s average rating decrease by 0.03 with every year that has passed since its release. Now, removing the age bias means reducing that slope to 0. It’s as if we consider each year on its own and only care how much better or worse a game was compared to its peers released at the same time. I hope this little animation will make things much clearer:
(Again, credit to Dinesh Vatvani for introducing this kind of visualisation in his article.)
Next, we can use those adjusted average ratings to calculate a new, debiased ranking. In order to do this, we recreate the BGG ranking by taking the Bayesian average, i.e., adding 2311 dummy ratings (one for every 10,000 ratings in total) of 5.5.
Without further ado, those are the new top 10 rated games after removing the age bias:
| Rank | Game | Rating |
|---|---|---|
| #1 (🔺 2) | Gloomhaven (2017) | 8.4 (🔻 0.2) |
| #2 (🔺 11) | Twilight Struggle (2005) | 8.4 (🔺 0.2) |
| #3 (🔻 1) | Pandemic Legacy: Season 1 (2015) | 8.4 (🔻 0.1) |
| #4 (🔺 4) | War of the Ring: Second Edition (2011) | 8.5 (🔸 0.0) |
| #5 (🔻 4) | Brass: Birmingham (2018) | 8.4 (🔻 0.2) |
| #6 (🔺 145) | Sherlock Holmes Consulting Detective (1982) | 8.5 (🔺 0.8) |
| #7 (🔸 0) | Terraforming Mars (2016) | 8.2 (🔻 0.2) |
| #8 (🔻 4) | Ark Nova (2021) | 8.2 (🔻 0.3) |
| #9 (🔺 36) | Puerto Rico (2002) | 8.2 (🔺 0.2) |
| #10 (🔻 1) | Star Wars: Rebellion (2016) | 8.2 (🔻 0.2) |
As designed, older games are the big winners of this adjustment, with former BGG #1s Twilight Struggle and Puerto Rico making a comeback. Classic murder mystery game Sherlock Holmes Consulting Detective makes a huge leap into the top 10 as one of the few games from the 80s that stood the test of time. You can download the full new ranking here.
Removing the complexity bias
Obviously, we can apply the exact same idea to other features, e.g., a game’s complexity (or weight) as Dinesh Vatvani did in his original article. Again, we start by looking at the spread of the data points, from the lightest games on the left to the heaviest on the right:
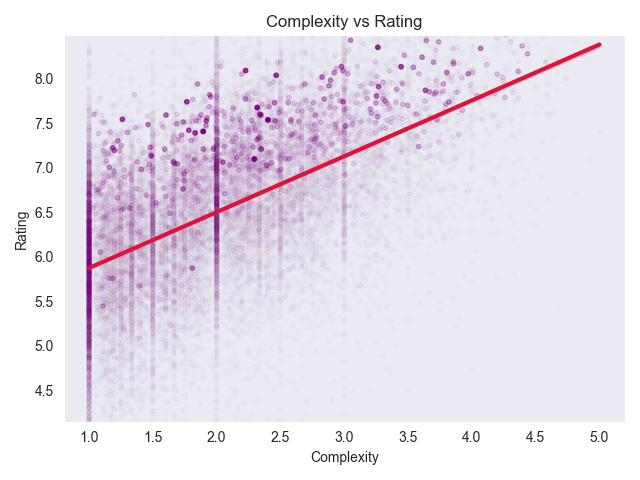
The trend line has a slope of 0.63, i.e., the heaviest games on BGG have on average a full 2.5 point higher average score than the lighest ones. Somehow it feels particularly pleasing to see the light but clever games being lifted up when we remove this complexity bias:
This is the new top 10 after adjusting for the complexity bias:
| Rank | Game | Rating |
|---|---|---|
| #1 (🔺 141) | Just One (2018) | 8.2 (🔺 0.6) |
| #2 (🔺 127) | Codenames (2015) | 8.0 (🔺 0.4) |
| #3 (🔺 45) | Cascadia (2021) | 8.0 (🔺 0.1) |
| #4 (🔺 101) | SCOUT (2019) | 8.2 (🔺 0.4) |
| #5 (🔻 3) | Pandemic Legacy: Season 1 (2015) | 8.0 (🔻 0.6) |
| #6 (🔺 13) | 7 Wonders Duel (2015) | 7.9 (🔻 0.2) |
| #7 (🔺 30) | The Crew: Mission Deep Sea (2021) | 8.1 (🔻 0.1) |
| #8 (🔺 71) | Azul (2017) | 7.8 (🔺 0.1) |
| #9 (🔺 117) | Patchwork (2014) | 7.8 (🔺 0.2) |
| #10 (🔺 57) | The Quacks of Quedlinburg (2018) | 7.8 (🔸 0.0) |
I’m not going to lie: As a lover of small and interactive games, this top 10 looks much more apealing to me than the actual BGG top 10. One striking observation: six out of these ten games won Spiel or Kennerspiel des Jahres (if we generously count the other Crew’s title), with two more nominated and the other two recommended. The grognards on the internet can complain all they want about how the awards have become too shallow, but the jury really knows how to pick out the games that put the maximum amount of game play into minimal rules. You can download the full new ranking here.
Removing the playing time bias
Next, we’ll take a look at how a game’s playing time (as measured by the minimum playing time printed on the box) affects its rating:
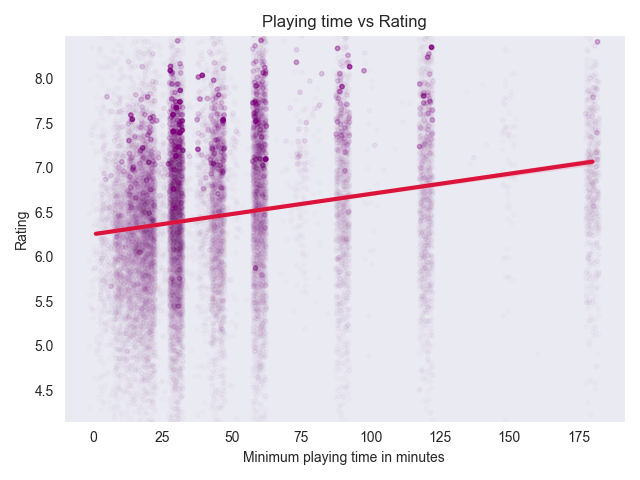
We see a similar trend line as with the complexity bias, which shouldn’t come as a surprise since a game’s length and complexity are highly correlated. The slope here is 0.0045, i.e., every minute it takes longer to play a game makes it 0.0045 points “better”, which does sound a bit weird when one puts it like that.
Because publishers love to lie about playing time and claim most games can be played in about an hour, the adjusted ranking doesn’t look all that different from the usual one, so I’ll skip it for this article, but you can download it here if you’d like to take a look anyways.
Removing the game type bias
So far, we’ve been looking at continuous values (also known as numerical features), but we can apply the same principal to categories. One particularly interesting feature in this context is a game’s type: BGG maintains separate rankings for eight different game types, and users can vote which of those types a game belongs to (depending on the share of votes, a game might be classified as more than one type). Given everything we’ve seen so far, you can probably already guess that the lighter categories like children’s and party games aren’t as highly praised as war and strategy games. Here’s all eight types sorted from lowest to highest average rating:
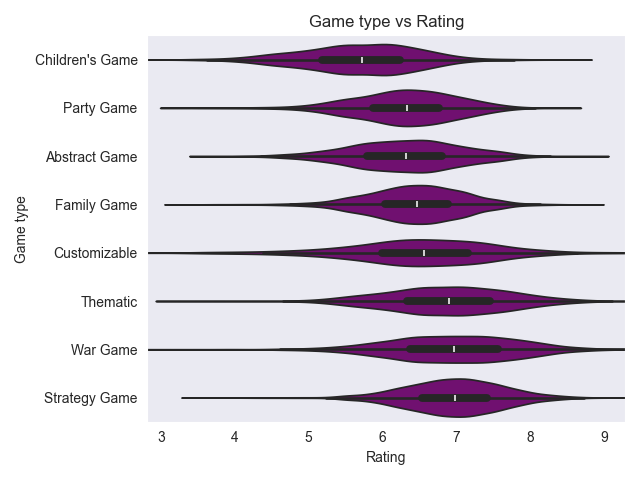
Each of those little violins represent the distribution of ratings amongst that type, with the white line indicating the median. Removing the game type bias now means bringing those distributions in line:
Just like before, we can calculate a new, debiased ranking:
| Rank | Game | Rating |
|---|---|---|
| #1 (🔸 0) | Brass: Birmingham (2018) | 8.2 (🔻 0.4) |
| #2 (🔺 7) | Star Wars: Rebellion (2016) | 8.2 (🔻 0.2) |
| #3 (🔺 1) | Ark Nova (2021) | 8.1 (🔻 0.4) |
| #4 (🔺 36) | Marvel Champions: The Card Game (2019) | 8.2 (🔺 0.1) |
| #5 (🔺 43) | Cascadia (2021) | 8.1 (🔺 0.1) |
| #6 (🔺 31) | The Crew: Mission Deep Sea (2021) | 8.2 (🔺 0.1) |
| #7 (🔺 34) | Heat: Pedal to the Metal (2022) | 8.1 (🔺 0.1) |
| #8 (🔻 2) | Dune: Imperium (2020) | 8.0 (🔻 0.4) |
| #9 (🔻 2) | Terraforming Mars (2016) | 7.9 (🔻 0.4) |
| #10 (🔺 11) | Nemesis (2018) | 8.0 (🔻 0.2) |
At first glance, it might seem curious that some games from the current BGG top 10 stay (more or less) put whilst others fall off. The reason for this is that both Pandemic Legacy: Season 1 and Gloomhaven are considered to be both strategy and thematic games, two of the most popular categories, and so the model weighs them down twice. Instead, we see some of the top rated customisable, abstract and family games in this adjusted top 10. Again, you can download the full new ranking here.
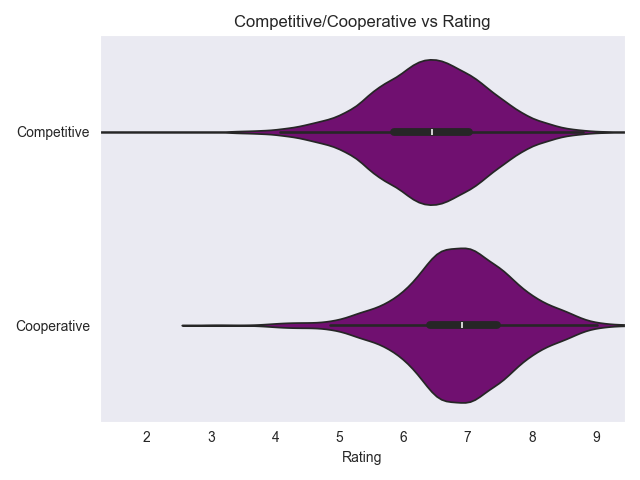
Removing the bias towards cooperative games
Let’s take a look at one final categorical feature to debias: competitive vs cooperative games. Cooperative games have been on the rise for a number of years now, winning six out of ten Spiel and Kennerspiel des Jahres awards since I started my predictions in 2020. While less than 9% of all games in our dataset are cooperative, on average they have a significantly higher (by almost 0.48 points) rating compared to competitive games:
We can go through the exercise of debiasing the ratings and calculating a new ranking here too, but the outcome would pretty much be just the standard BGG ranking with the cooperative games filter out (or rather weighed down). If you really want to take a look, you can download the new ranking here.
Removing all the biases
OK, so you might be wondering by now why I went through all that trouble, in particular since complexity, playing time and game types are all so strongly correlated. You’ve probably also been thinking association isn’t causation. You’d be right: viewing those different features individually, this approach yields nothing but correlations. But take them all together and we get a shot at a bit of causal inference.
How does it work? So far, I’ve calculated those trend lines using simple linear regression (also known as the ordinary least squares method) in a single explanatory variable. But the maths works just the same in higher dimensions and we can throw all the features discussed above at once into a single model, predicting again the game’s rating, but now with much more information. The outcome is this:
Estimated rating =
-0.031 * age in years
+0.567 * complexity score
-0.001 * minimum playing time in minutes
+0.167 if an abstract game
-0.029 if a children’s game
-0.030 if a customizable game
+0.225 if a family game
+0.274 if a party game
+0.125 if a strategy game
+0.125 if a thematic game
+0.485 if a war game
+0.199 if cooperative
+5.700
It’s worth taking a look at and comparing some of those coefficients. First of: Age and complexity have about the same influence in this combined model as they had individually. This means that age and complexity biases are real. Even when taking other factors into account, gamers clearly strongly prefer newer over older and heavier over lighter games.
Interestingly, something different is happening with playing time: If you recall, the original model estimated that every minute of additional playing time increased the rating by around 0.005, but this model tells us that every minute extra actually decreases a game’s rating by 0.001. This number is very small, but the direction is still statistically significant. This is a sign that the model correctly decoupled what we discussed before intuitively: the positive correlation between a game’s length and rating can be explained by the game’s complexity. Once we take that into account, any additional playing time actually harms the game’s rating. In other words: Our model finds that – all other features being equal – players do prefer shorter over longer games.
We observe some similar effects with the game types. In the single feature model, children’s games were rated over 0.6 points lower. But in this multi feature model, the coefficient is very close to zero, in fact not statistically significantly different. This is evidence that the ‘geeks don’t actually have a systematic bias against children’s games – they dislike all light games equally, no matter whether they are for children or adults.
Finally, the bias in favour of cooperative games is still pretty clear, but at around 0.2 it’s less than have what the single feature model predicted. They clearly are very fashionable, but much of their higher average ratings can be explained by other variables.
Enough looking at coefficients, let’s finally move on to the moment you didn’t even know you were looking forward to: the ultimate debiased ranking. Just like with all the other models, we can use this multivariate model to debias the games’ ratings by simply setting all those coefficients to zero. We lose the ability to animate this process for easy visualisation, but we gain average ratings and a ranking freed of all the biases we’ve been talking about:
| Rank | Game | Rating |
|---|---|---|
| #1 (🔺 323) | Survive: Escape from Atlantis! (1982) | 8.2 (🔺 0.9) |
| #2 (🔺 772) | Can’t Stop (1980) | 8.2 (🔺 1.3) |
| #3 (🔺 326) | For Sale (1997) | 7.9 (🔺 0.7) |
| #4 (🔺 15) | 7 Wonders Duel (2015) | 7.8 (🔻 0.3) |
| #5 (🔺 146) | Sherlock Holmes Consulting Detective (1982) | 7.9 (🔺 0.3) |
| #6 (🔺 209) | Tichu (1991) | 8.0 (🔺 0.4) |
| #7 (🔺 205) | Modern Art (1992) | 7.9 (🔺 0.4) |
| #8 (🔺 637) | Take 5 (1994) | 7.8 (🔺 0.8) |
| #9 (🔺 316) | Lost Cities (1999) | 7.7 (🔺 0.5) |
| #10 (🔺 204) | Carcassonne (2000) | 7.6 (🔺 0.2) |
| #11 (🔺 177) | Jaipur (2009) | 7.7 (🔺 0.2) |
| #12 (🔺 117) | Codenames (2015) | 7.6 (🔺 0.1) |
| #13 (🔺 125) | Ra (1999) | 7.7 (🔺 0.1) |
| #14 (🔺 141) | Ticket to Ride: Europe (2005) | 7.6 (🔺 0.1) |
| #15 (🔺 76) | El Grande (1995) | 7.7 (🔻 0.1) |
| #16 (🔻 9) | Terraforming Mars (2016) | 7.6 (🔻 0.8) |
| #17 (🔻 15) | Pandemic Legacy: Season 1 (2015) | 7.6 (🔻 0.9) |
| #18 (🔺 289) | Telestrations (2009) | 7.8 (🔺 0.4) |
| #19 (🔺 211) | Ticket to Ride (2004) | 7.5 (🔺 0.1) |
| #20 (🔺 85) | SCOUT (2019) | 7.8 (🔻 0.1) |
| #21 (🔺 273) | Battle Line (2000) | 7.8 (🔺 0.3) |
| #22 (🔺 634) | HeroQuest (1989) | 7.8 (🔺 0.6) |
| #23 (🔺 368) | Dixit (2008) | 7.5 (🔺 0.3) |
| #24 (🔻 8) | The Castles of Burgundy (2011) | 7.5 (🔻 0.6) |
| #25 (🔻 19) | Dune: Imperium (2020) | 7.5 (🔻 0.9) |
I will say: Survive: Escape from Atlantis! is not a game I would have expected on top of this list. In general, this top 25 is clearly much lighter and less recent than the regular BGG ranking. Personally, I’m up for this: it’s a wonderful list full of proven classics, devoid of any cult of the new or Kickstarter bloat.
Some games made huge leaps into the top 100, including Rummikub, Loopin’ Louie and Animal Upon Animal which all jumped up over 1000 positions. The biggest losers of this method – games dropping out of the top 100 – are On Mars, Root and Mage Knight, all of which lost 1000 positions and more. You can download the full debiased ranking here.
Some boring technical details
In order to have good data and comparable values for all those corrections, I had to filter out games by certain criteria. We only considered games which:
- are ranked (i.e., rated by at least 30 users),
- have a complexity score,
- have been released between 1970 and 2024 and
- have a minimum playing time of at most 3 hours.
This includes 23,325 of the 26,266 currently ranked games (88.8%), but does exclude some notable games, such as:
- Twilight Imperium, Paths of Glory and Die Macher (too long), as well as
- Crokinole, Go and Acquire (too old).
Those are the highest ranked exclusions. While it’s definitely sad to miss out on those and some other games, they make up only 2% of the top 1000 games on BGG, so I feel it’s a reasonable tradeoff.
Conclusion
So that’s a wrap on our quest for debiased rankings. It’s important to remember that bias isn’t a negative term in this context – we’re simply interested in the tendencies that pertain to the BGG user ratings and try to imagine counterfactual rankings if those tendencies didn’t exist. By considering not just a single feature like age or complexity, but throwing those two as well as playing time, game type and cooperative into one model, we hope to explain the way those features influence ratings beyond mere correlations. If you’re interested in the mathematical background to this method, I highly recommend the article I’ve already linked above.
As always, you can find the full analysis code and notebooks on GitLab.