TL;DR: BoardGameGeek calculates its ranking by adding around 1500-1600 dummy ratings of 5.5 to the regular users’ ratings. They called it their geek score, statisticians call it a Bayesian average. We use this knowledge to calculate some alternative rankings.
I often describe BoardGameGeek (BGG) as “the Internet Movie Database (IMDb) for games”. Much like its cinematic counterpart, the biggest board game database not only collects all sorts of information obsessively, but also allows users to rate games on a scale from 1 (awful - defies game description) to 10 (outstanding - will always enjoy playing). These ratings are then used to rank games, with Gloomhaven occupying the top spot since December 2017.
While BGG founder Scott Alden admitted in a recent interview on the excellent Five Games For Doomsday 🗄️ podcast that he doesn’t care all that much about the rankings, gamers around the world certainly do. They would discuss heatedly any movement in the rankings, question why games X is up there while game Y is missing, and generally criticise the selection for either having too many or not enough recent releases.
Reason enough for me to take a closer look at how the rankings work and some of the maths behind it.
Generally speaking, we want to rank a game higher the better its score is. The first instinct would be to just sum up all the ratings users gave to that particular game, divide by the number of ratings, and rank games from highest to lowest. What I just described would be the arithmetic mean (or just average if you feel less fancy) of the ratings, which is simple and intuitive, but suffers from a sever defect: a game with a single rating of 10 would always sit on top of the ranking, well ahead of much beloved games with thousands of votes that couldn’t possibly be all 10s.
The easiest fix is filtering out games with less than a certain number of ratings, say 100.1 That’s a decent enough approach, and yields the following top 5 games as of the time of writing:
- Dungeon Universalis
- Arena: The Contest
- Gloomhaven: Jaws of the Lion
- Core Space
- World At War 85: Storming the Gap
Notably, those are all very recent games with relatively few ratings.2 Some might consider this a feature, not a bug, but when your intention is to create a list of the best board games, you probably do want to give a nod to proven classics, and not just the latest hotness. How to balance out these ends of the spectrum is in the end a choice you have to make, and no matter what it is, People on the Internet™ will not like it.
The way both IMDb and BGG chose to tackle this issue is by essentially not trusting the ratings – at least not too much. The method boils down to assigning a new item in the database (be it movie or game) a predefined average by default, and only gradually trusting the ratings’ average as thousands and thousands of users have cast their votes. More concretely the rankings are calculated by adding a number of dummy ratings with a chosen average value, say 5.5, to each game’s regular ratings. The result is that initially each game will have a score close to 5.5, but as more users rate the game, that score will move closer and closer to the conventional mean.
BGG calls this their geek score. Mathematically speaking, it is a Bayesian average, and calculates as follows:
\[ \textrm{geek score} = \frac{\textrm{sum of ratings} + \textrm{number of dummies} \cdot \textrm{dummy value}}{\textrm{number of ratings} + \textrm{number of dummies}}, \]
where sum of ratings can be calculated either by, well, summing up all ratings or via number of ratings ⋅ average rating. Don’t worry too much about the details though – adding dummy ratings is really all you need to understand.
OK, so that’s the concept, but crucially that’s not all the details. You still need to choose how many dummy ratings you want to add and what value they should take. Since People on the Internet™ who disagree with your ranking will try to manipulate it in whatever way they can, sites are usually very cagey about said details. IMDb used to be more transparent, as was BGG, but now we have to dig a little deeper.
Let’s start from the easier of the two, the value of the dummy ratings. It is commonly chosen to represent some prior mean, i.e., some decent estimate of the rating a new game in the database would have. A frequent choice would be to use the average rating across all games. It’s a fair assumption – without further information about a game, we don’t know if it’s any better or worse than the average game. However, Scott Alden actually gave away the answer in that interview from the beginning: BGG chose the dummy value to be 5.5. Their rationale is that ratings range from 1 through 10, so 5.5 is the midpoint. Of course, people tend to rather play and rate much more the games they like, and so the average rating is around 7. Opting for the lower value here is part of the design of the ranking: it means a new game would enter the ranking rather at the end of the pack. On the other hand, using the mean as the dummy value means a new game is placed more or less in the middle. It is worth mentioning that IMDb does use the mean (or at least used to), but they only ever publish the top 250 movies, and don’t care about the crowd behind.
The other value, the number of dummy ratings, requires more work. Because some of the details and data are unknown, we cannot actually pin down the exact number that BGG is using. Instead, we’ll try three different approaches, and compare their results.
Formula
On the surface, this should be super easy to solve: in the formula above, we know every single value but the number of dummy ratings. BGG publishes the number of ratings, their arithmetic mean, and the “geek score” or Bayesian average for every game, and we know that the dummy value is 5.5. With a little high school algebra we solve the formula for number of dummies:
\[ \textrm{number of dummies} = \textrm{number of ratings} \cdot \frac{\textrm{average rating} - \textrm{geek score}}{\textrm{geek score} - \textrm{dummy value}} \]
Now we should be able to plug in those values for any given game, say Flamme Rouge, and get the result. With 10,936 ratings that average 7.562, and a geek score of 7.266, this yield:
\[ \textrm{number of dummies} = 10936 \cdot \frac{7.562 - 7.266}{7.266 - 5.5} \approx 1830. \]
So, there’s about 1830 dummy ratings, end of story. Right? Unfortunately, not quite. When computing this formula for different games, the results vary wildly, as you can see from this histogram over the results for the same calculation with other games:
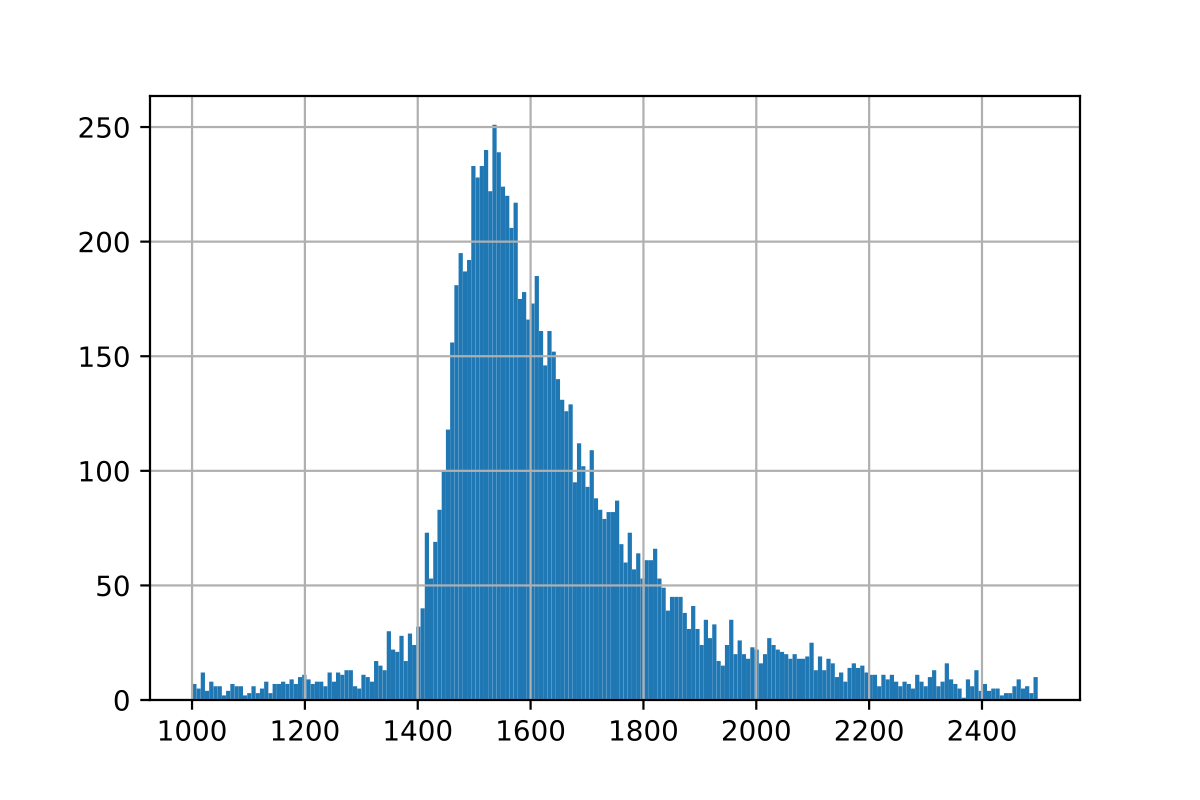
And this plot is even cropped, the results vary from -1.4 million to +810 thousand, though some 90% lie within the above range, with a mean of around 1604 and a median of around 1590.
What’s going on, why are the results so inconsistent? The problem is the ranking’s secret sauce. Both IMDb and BGG stress is that they only consider regular voters for their rankings. That’s the most mysterious part of the system as it’s the easiest to manipulate, so we’ll just have to take their word for it. For this investigation it means that the average rating BGG publishes includes all the ratings, but the geek score might not.
Still, clearly something is happening around the 1600 ratings mark, so we are at least getting closer to an answer. If exact calculations won’t work, maybe we can approximate the correct value instead?
Trial & error
Let’s take a step back here. What we’re really trying to achieve here is not finding the exact formula for that mysterious “geek score”, but rather recreate the BGG ranking. That is, we want to find the values in the above formula, such that the resulting ranking matches BGG’s ranking as closely as possible. Luckily, statistics has all the tools we need. Spearman correlation measures rank correlation – just what we need. This will be 1 if both rankings sort in exactly the same way, 0 if there’s no relation, and -1 if they sort exactly the opposite way. Again, don’t worry about the details, just trust the maths.
What we can do now is fairly simply and quickly compute the rankings for different number of dummy ratings, and pick the value with the highest Spearman correlation. Without further ado, here are the results:

The best correlation of around 0.996 is achieved with 1488 dummy ratings. However, it is worth noticing that the changes in the correlation are very, very small throughout the range we examined here (1000 to 2500), so let’s dig still a little deeper.
Optimisation
What we have here at hand is actually a classic optimisation task: a real valued function in one unknown (or two if we allow a variable dummy value as well) which we’d like to maximise. This is a well-studied field, with many fast and simple implementations that provide us the solution in no time. Unsuprisingly, we get the same result as above: the best possible correlation is 0.996 with around 1488 dummy ratings.
But since we made it this far, let’s take it one step further. So far, we tried to optimise the correlation in order to recreate BGG’s ranking. However, we can also try to recreate the actual geek scores. That is, we can look for the number of dummy ratings that will yield the closest to the actual geek score with our calculations. What exactly we mean by “closest” is up to us to define. A common metric is the mean squared error.3 It’s not worth getting into the maths here either, but the general idea is that we want to punish outliers in our estimates more (qudratically so) the further away they lie from the actual datapoint. Long story short, this yields a minimum for around 1636 dummy ratings.
Let’s take one last swing and see what happens if we don’t fix the dummy value at 5.5 but allow that to be variable as well. This is no problem for the optimisation algorithm and yields the following results:
- the best correlation with 1942 dummy ratings of 5.554, and
- the least squared error with 1616 dummy ratings of 5.494.
Either of those improvements in the performance metrics are hardly noticable (in fact insible after rounding), but they do confirm nicely a dummy value of 5.5.
Conclusion
All things consider, we can be confident that BoardGameGeek calculates their rankings by adding around 1500 to 1600 dummy ratings of 5.5 to the regular users’ ratings. What exactly constitutes a regular user, and what ratings might be discarded due to shilling, remains a well guarded secret though. Note that the number of dummies is pegged to the overall number of ratings, so this is a moving target, and the calculations would change as time passes.
Now I must applaud anybody who actually made it all the way through this pretty dry and technical article. The real reason why I dwelled so much on the ratings, and how they are compressed into the BGG rankings, is to get a feeling of what’s going on behind the scenes, what the can express, and what they cannot or even do not try to express. Another major take-away is that any of these decisions are choices that need to be made and that come with certain tradeoffs – like them or not.
In this particular case, I have the feeling that both the Cult of the New™ and connoisseurs of classic games are equally unhappy about the BGG top 100, which one should probably consider a compliment.
Alternative rankings
I’ll send you off with some rankings that were obtained by making different choices for the two values that we discussed throughout this article: the number of dummy ratings and their value.
Using the ratings average as dummy value
I’ve mentioned before that the average rating across all games is around 7 – a little1 more precisely 7.08278. What if we chose that as the dummy rating, but left their number at 1600? The result should be a ranking that is a little friendlier to newer titles with fewer ratings as their score isn’t dragged all the way down to 5.5 in the beginning.
- Gloomhaven
- Pandemic Legacy: Season 1
- Twilight Imperium (Fourth Edition)
- Brass: Birmingham
- Kingdom Death: Monster
- Terraforming Mars
- Gloomhaven: Jaws of the Lion
- Gaia Project
- Through the Ages: A New Story of Civilization
- Star Wars: Rebellion
Sure enough, the brand new Jaws of the Lion with less than 3000 ratings already shows up in the top 10. The other game that sticks out here is Kingdom Death: Monster. This Kickstarter success story clearly attracted a lot of enthusiasts, but not necessarily the mass.
Using the top 250 number of ratings
Just like IMDb publishes only their top 250 movies, we can consider the same and crank up the number of dummy ratings. A good number seems to be the 250th most rated game on BGG, which has been rated 12,014 times. Using BGG’s standard dummy value of 5.5, we obtain a ranking that is much more skewed towards proven classics:
- Gloomhaven
- Terraforming Mars
- Pandemic Legacy: Season 1
- Scythe
- Twilight Struggle
- 7 Wonders Duel
- Puerto Rico
- The Castles of Burgundy
- Agricola
- Terra Mystica
The most recent release on this list is Gloomhaven, but we also meet again old BGG #1’s: Puerto Rico and Agricola.
Combining both!
Finally, let’s do what IMDb does (or used to do), and add to each game’s ratings 12,014 dummy ratings of 7.08278:
- Gloomhaven
- Pandemic Legacy: Season 1
- Terraforming Mars
- Scythe
- Twilight Struggle
- Brass: Birmingham
- Through the Ages: A New Story of Civilization
- Star Wars: Rebellion
- Great Western Trail
- 7 Wonders Duel
The effects of more, but higher dummy ratings seem to almost cancel each other out. Compared to BGG’s actual top 10, only Twilight Imperium and Gaia Project are missing, otherwise this ranking looks very familiar. Turns out, BGG did a pretty good job designing its ranking!
Read the second part here where we nail down the number of dummy ratings to the dot.
PS: You can find the notebook I used to do all the calculations on Kaggle.
PPS: Turns out that GoDataDriven did almost the same calculation 🗄️ three years ago – even with the same title! Back then, they estimated that BGG added 725 dummy ratings. Jorge Nieva replicated their analysis with a more recent dataset, which thankfully yielded a very close match to our result: 1594 dummy ratings.
Throughout this article I only considered games with at least 100 ratings, mostly to ensure that the very long tail of games with few ratings won’t unduely skew the results. However, most of the calculations would only change in some negligible decimals when including all games. ↩︎ ↩︎
Jaws of the Lion is something of an exception here and will undoubtably shoot into the BGG top 10 very soon. In fact, it might be the only game with the potential to unseat Gloomhaven as the number 1. ↩︎
It’s probably even more common to use the root mean squared error, but for boring mathematical reasons, it doesn’t make a difference when it comes to optimisation. In fact, we could even drop the word mean from our metric and still obtain the same optimal point, so let’s not dwell on this. ↩︎