Shut Up & Sit Down
Shut Up & Sit Down (SU&SD) is arguably the largest (at over 400k subscribers) and most influential YouTube channel in board gaming. A video with a glowing recommendation by them can lead to a game sell out overnight. Or at least that’s how the anecdotes go. There’s been previous attempts at quantifying the effect, but over here at Recommend.Games is where board games and data science meet, so obviously, we have to dig a little deeper.
John Company
Their recent1 review of John Company is an interesting case study:
The game was by no means a hidden gem before: designer Cole Wehrle has two games in the BoardGameGeek (BGG) top 50 with Root and Pax Pamir, the latter being released by his own publishing house Wehrlegig Games as well. So it’s fair to say that John Company already had a lot of eyes on it. Still, when we look at the number of ratings2 on BGG, it’s hard to deny the apparent increase in the slope after the video was released:

One might simply draw a line through the number of ratings before the video and extrapolate it to the present, then call the difference to the actual number of ratings the “Shut Up & Sit Down effect”. But if you’re reading this blog, your mind is probably of the kind that immediately goes: “Hang on, how do we know the increase is actually because of SU&SD and not because of some other unrelated reason?” The problem is that we don’t have a “control world”: one that has never been exposed to the video, but is otherwise identical to ours. These kinds of counterfactual questions are what keeps business analysts up at night (luckily that’s not me, so writing blog posts like this one keeps me up instead 😅).
So how can we know that it really was the SU&SD video that drew the extra attention to the game and not, for instance, just the fact that we approached Christmas and people were just buying, playing and rating more games? 🤔
Synthetic Control
Enter synthetic control. As said, we don’t have a control world that wasn’t exposed to the video – so instead we synthesise one! At first, this might sound more like alchemy than science, but the basic idea is really quite simple: we look at the number of ratings up to the day of the video and compare those to other, similar games over the time period. A weighted sum of those games’ ratings then gives us a “synthetic” version of the game which closely approximates the number of ratings up to the video. Because John Company got the SU&SD treatment, but the other games didn’t, we can reason that the same weighting of the other games’ ratings after the video should give us a good estimate of what would have happened to John Company if it hadn’t been for the video.
Concretely, we’ll look at all the games on BGG and sample 300 of them that are most similar to John Company in terms of the number of ratings before the video. We then try to find a convex combination (i.e., the weights need to sum to 1) of these games that best approximates the number of ratings of John Company before the video. If this all sounds like gibberish, don’t worry, just take my word for it that the algorithm3 spits out this model:
Synthetic John Company =
+30.7% * Libertalia: Winds of Galecrest
+20.9% * Tribes of the Wind
+18.3% * Kingdomino Origins
+12.3% * Freelancers: A Crossroads Game
+8.2% * Revive
+5.5% * Cartographers Heroes
+4.2% * Imperium: Legends
It’s worth stressing one thing: during training, the model only gets to see the number of ratings up to the review date. The idea is that the weighted sum of the ratings of those games are a “synthetic” version of John Company. Since those games did not receive the SU&SD treatment, this synthetic gives a glimpse into a world where that video was never made. Without further ado, this is what the fake ratings look like compared to the real ones:
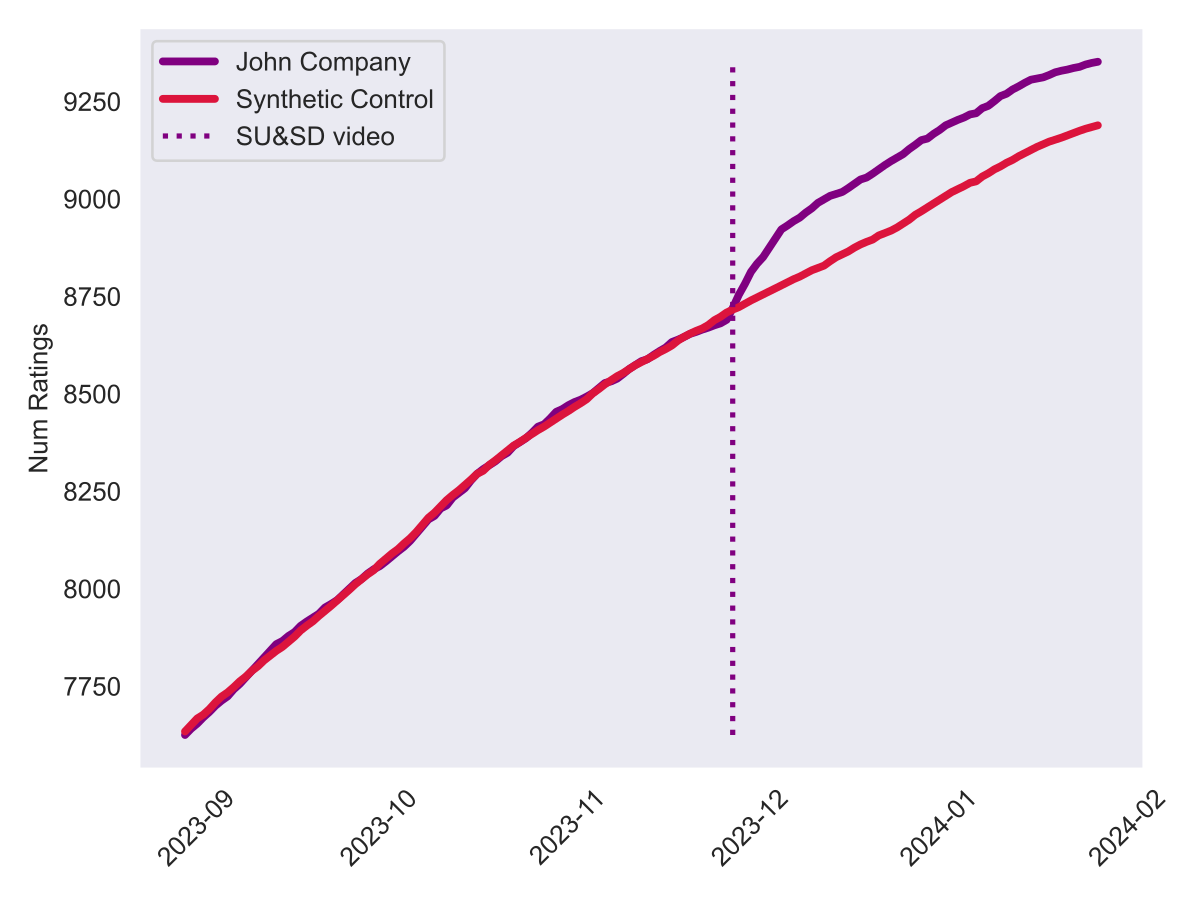
So, it looks as though our synthetic John Company would have continued to steadily gather attention, just without that bump in the days after the video’s release. In the 60 days after the video, our synthetic John Company received 498 new ratings, while the real one got 662. So it looks like the SU&SD effect added about 164 ratings to the game, which is roughly a quarter of all new ratings in that period.
Another way to visualise this effect is plotting the difference between the real and the synthetic John Company:

Because the synthetic version is meant to approximate the number of ratings of the real numbers until the review is published, the line dances around 0 on the left hand side. Right after the review, we see a steep incline for about a week, which then flattens out. This is the SU&SD effect in action.
You might still not be quite convinced that this is an isolated effect for John Company. How do we know that other games didn’t see a similar, if not bigger effect? Is this observation in any way significant? One way to approach an answer is called Fisher’s exact test. Applied to our situation, we can simply pretend that other games got the same treatment and see if a similar synthetic control model shows the same effect. In practice, we sample around 120 games with a similar number of ratings as John Company, calculate the same synthetic control model for each of them, and then compare the difference between the real and synthetic number of ratings after the review. A picture is worth a thousand words, so let’s look at the result plot:

The strong line is the same as the one in the previous plot, but the faint lines are the differences for the other games. Again, all the lines on the left meander around 0, as expected, while they stray to different positive or negative values after the review. That kind of spread is typical for random observations without actual underlying cause. It’s clear that John Company really received an exceptional amount of attention after the SU&SD review.
The absolute numbers might not sound impressive for a video with over 300'000 views, but keep in mind that only a fraction of board game enthusiasts are active on BGG. Further, in an industry where a couple of thousand copies sold is considered a success, a couple of hundred additional ratings is nothing to sneeze at. Of course, whether this kind of activity on BGG translates to actual sales is a different question entirely.
What about the other videos?
Obviously, this was just one video and one game. Can we see a similar effect in other games that SU&SD has covered? Let’s check the same plot for some other videos.
Noticeable increase 📈
Most games covered by SU&SD will see a clearly visible uplift in interest, such as Phantom Ink. The model predicted interest to somewhat fizzle out, but the video introduced more players to the game:

The Bamboo review produced a clear bump in interest, which then continued rather in parallel of the synthetic version after a couple of days:

Coverage of Hamlet clearly led to a similar bump right after the review, but interest continue to rise afterwards:

Supercharged 🚀
Some games, in particular hidden gems, really thrive under the spotlight SU&SD shines on them. Five Three Five is one such example. Over 70% of the new ratings after the review can be attributed to its review:

The number for My Gold Mine is even close to 90%. This game was recommended by the Spiel des Jahres jury, so hardly unknown, but clearly it needed SU&SD to introduce it to the English speaking world:

Stomp the Plank is a children’s game, a genre the BGG crowd generally ignores. Consequently, there was a steep incline in interest right after the review was published. It’s interesting though that the model predicts a significant increase even without the video, so the SU&SD effect here is “only” about 33%:

No (or negative) effect 🫤
Interest in a game doesn’t skyrocket in all cases after a SU&SD video, sometimes it seems to make hardly a difference – and some coverage might actually harm a game, even though SU&SD rarely releases truely negative reviews.
Golem’s reception was definitely rather lackluster, and consequently ratings have gone up a little, but not dramatically:

Amun-Re (another Knizia classic) saw a bit of a typical SU&SD bump, but by end of the 60 day period we examined here, the effect had completely evaporated:

SU&SD’s video about Frosthaven might have actually harmed that game…? 🤷 The site has been a vocal fan of the series, so the more plausible explanation for declining interest is probably rather saturation:

There’s a saying in data science: all models are wrong, but some are useful. While synthetic control is a powerful tool that provides interesting insights in some cases, it might also be misleading in other cases. Always interpret with caution. 🧐
Full results
Here’s an overview over most of the videos SU&SD has released in 2023 and the impact they had on the games they covered:
| Game | Review date | SU&SD effect | Plot |
|---|---|---|---|
| John Company | 2023-11-28 | +24.6% | [link] |
| Phantom Ink | 2023-10-26 | +43.5% | [link] |
| Zoo Vadis | 2023-10-19 | +64.9% | [link] |
| Moon | 2023-10-12 | +69.2% | [link] |
| Bamboo | 2023-10-05 | +50.3% | [link] |
| Earth | 2023-09-28 | -19.0% | [link] |
| Amun-Re | 2023-09-22 | +1.7% | [link] |
| Bohnanza | 2023-09-14 | +20.9% | [link] |
| Five Three Five | 2023-08-23 | +71.6% | [link] |
| Golem | 2023-08-17 | +12.8% | [link] |
| My Gold Mine | 2023-07-19 | +89.6% | [link] |
| Stomp the Plank | 2023-07-06 | +33.2% | [link] |
| IKI | 2023-06-29 | +32.5% | [link] |
| War of the Ring: The Card Game | 2023-06-15 | +25.4% | [link] |
| Beast | 2023-06-09 | -18.6% | [link] |
| Hamlet | 2023-05-25 | +66.8% | [link] |
| Guards of Atlantis II | 2023-05-18 | +52.7% | [link] |
| Frosthaven | 2023-05-11 | -30.4% | [link] |
| Horseless Carriage | 2023-02-09 | +35.2% | [link] |
| Rummikub | 2023-01-26 | -6.1% | [link] |
| Heat: Pedal to the Metal | 2022-12-22 | +19.1% | [link] |
![[link]](332686_synthetic_control.svg)
![[link]](330592_synthetic_control.svg)
![[link]](368061_synthetic_control.svg)
![[link]](358386_synthetic_control.svg)
![[link]](351538_synthetic_control.svg)
![[link]](350184_synthetic_control.svg)
![[link]](354568_synthetic_control.svg)
![[link]](11_synthetic_control.svg)
![[link]](311031_synthetic_control.svg)
![[link]](298383_synthetic_control.svg)
![[link]](331571_synthetic_control.svg)
![[link]](367771_synthetic_control.svg)
![[link]](177478_synthetic_control.svg)
![[link]](362944_synthetic_control.svg)
![[link]](281549_synthetic_control.svg)
![[link]](276086_synthetic_control.svg)
![[link]](267609_synthetic_control.svg)
![[link]](295770_synthetic_control.svg)
![[link]](350205_synthetic_control.svg)
![[link]](811_synthetic_control.svg)
![[link]](366013_synthetic_control.svg)
Even more detailed results can be found here.
Conclusion: the Shut Up & Sit Down effect is real
According to synthetic control, in the weeks after a SU&SD video is published, 20% to 60% of the new ratings can be attributed to that review, in extreme cases up to 90%. In other words, for some games interest increases tenfold. It’s hard to deny, SU&SD exercises a great deal of influence over the hobby – and finally we got some numbers to back up the anecdotes. They’ve worked for over a decade on sharing the love for board games with a broader audience, and it’s clear that they’ve been successful in doing so.
As powerful as this method is, let’s not forget some caveats: First off, we cannot exclude the possibility of some other “intervention” that might have caused the increase in interest. Maybe the video conincided with a crowdfunding campaign or some other “influencer” mentioning the game on their feed. We did our best to work out that some significant “treatment” happened on the day of the review, but we can’t be sure it’s SU&SD.
Second, let’s not forget not all interest is good interest. We considered the number of new ratings, but we didn’t at all take into account if they were positive ratings. A review might well be devastating, which leads to large number of interest being detected by this method, but it’d probably be unwanted attention and actually harm sales. Our model wouldn’t know the difference.
The review of John Company is actually a good example of this complexity: the video was by no means just a glowing “must buy” hype fest, but rather a 48 minute video essay full of nuiances that probably contained as many praises for the design as caveats why this game might not be for everyone – or in fact for most people. (If you, for some reason, spent your time reading this article but haven’t watched the video it’s about, do yourself a favour and watch it now. It’s really excellent.) So much of the activity on BGG following the review might well have been “thanks, but not for me” – it’s hard to tell.
Still, after spending a lot of time looking at the data, I’m convinced that the SU&SD effect is real. And it’s a good thing, too: the hobby needs more people to play and enjoy games, and SU&SD is doing a great job at that. 🎲
Postscriptum: the technical details
I’ve cut a great deal of details about the data and the method from this article as I wanted to focus on the outcome and not get bogged down in how we got there. If you want to learn more about synthetic control, I highly recommend the corresponding chapter 🗄️ of Causal Inference for the Brave and True 🗄️, which directly inspired the method and plots of this article. If the book can’t convince you of synthetic control, maybe the Washington Post 🗄️ can.
If you want to verify the model and run the code yourself, as always you can find the complete code from GitLab.
Finally, let me conclude by saying that I’ve spent a lot of time on this article (probably much more than I should have 😅), so I hope you enjoyed it and learned something interesting. I know I did. 🤓 If you did too, please consider sharing it with your friends, on social media or wherever the cool kids hang out these days. It’s a great way to support the blog and help it grow. 🙏
I’ve been working on this article for a very long time, OK? When I started writing it, the video was pretty recent. 😅 ↩︎
Those numbers are actually the number of all “collection items” on BGG, which include ratings, owned and pre-ordered games, wishlists, logged plays and more. For the sake of simplicity, I just refer to “ratings” throughout. This number is obviously just a coarse proxy for interest (positive or negative), but at least it’s a number we can measure and have readily available thanks to the scraping I do for Recommend.Games. Also note that the values are somewhat approximate since I don’t have all the freshest data at all times. Approximations upon approximations to synthesise a counterfactual world – but it’s the best we’ve got. 🤷 ↩︎
Sequential Least Squares Programming (SLSQP). I’m glad you asked. 🤓 ↩︎