A year in the making
The 2026 World Snooker Championship is under way at the Crucible in Sheffield — a natural point to rerun the forecast from last April, when we put Elo on five decades of results and ran ten million tournament simulations. John Higgins led our list at 13.14%; Zhao Xintong was fourth at 10.58% but took the 2025 title and has stayed at or near the top of the ratings since.
The methodology is unchanged — same formula, same full-draw simulation — with the working still laid out in the piece linked above. With another year of data the optimiser now prefers \(K = 44.6\) instead of 42, a nudge that barely shifts the picture.1 What has moved is twelve more months of results and the shape of the field. Here is where things stand.
The updated rankings
Here are the ten highest-rated players heading into the 2026 World Championship:
| Rank | Name | Elo | Matches | First match |
|---|---|---|---|---|
| 1 | Zhao Xintong | 817.4 | 511 | 2012-06-18 |
| 2 | Judd Trump | 768.3 | 1475 | 2005-11-03 |
| 3 | John Higgins | 696.9 | 1526 | 1992-10-25 |
| 4 | Wu Yize | 674.6 | 240 | 2019-02-20 |
| 5 | Zhou Yuelong | 663.5 | 580 | 2012-02-27 |
| 6 | Kyren Wilson | 641.7 | 1110 | 2010-06-27 |
| 7 | Ronnie O’Sullivan | 631.7 | 1118 | 1992-09-24 |
| 8 | Mark Selby | 629.0 | 1519 | 1999-09-19 |
| 9 | Mark Allen | 628.8 | 1098 | 2005-07-20 |
| 10 | Barry Hawkins | 621.5 | 1206 | 1997-03-25 |
Zhao Xintong’s rise is the defining story of the past year. Twelve months ago he was fifth at 687.6. He now leads by some margin at 817.4 — a gain of nearly 130 points. Compare that to Judd Trump in second, 50 points back at 768.3. At the height of Trump’s dominance, in early 2021, he reached an Elo of around 855; Zhao’s current 817 is already approaching that territory, accumulated in roughly a third as many career matches.
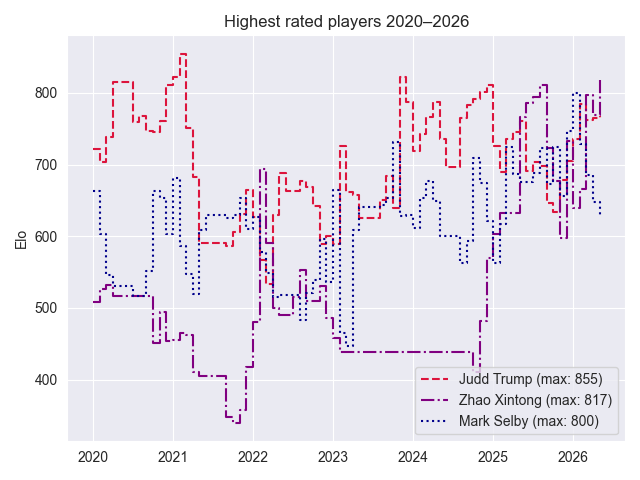
Zhao’s curve tells the story of the decade so far: a rapid climb in 2021–22, then the flatlining of his two-year ban for match-fixing, then an even steeper ascent on his return. The suspension is written into his match count (511) as much as his rating; the curve makes clear he picked up exactly where he left off — and then some.
Last year we noted that Ronnie O’Sullivan’s rating had collapsed to 345.2 — dead last among all participants — because withdrawals count as losses in our model. He’s now seventh at 631.7. The rehabilitation is real, though it still leaves him well below his career peak. The gap between his model and market valuations remains one of the most interesting features of the comparison below.
Also worth noting: Wu Yize (4th, a mere 240 career matches to his name) and Zhou Yuelong (5th) are the next wave of Chinese talent following Zhao into the top five. Joe O’Connor, who was sixth last year, has dropped well outside the top ten.
10 million simulations, again
Same as last year: following the actual draw, for each match I compare the two players’ Elo ratings, convert them into a win probability, and simulate who goes through; that repeats for every round of the 32-player knockout until the final produces a champion. I ran 10 million such full tournaments. Because the simulation follows the actual draw, bracket position matters: two players with similar Elo can end up with very different win probabilities depending on their path — which is why Hawkins (10th by Elo) simulates slightly ahead of Wilson (6th).
Disclaimer: This section discusses betting odds for the purpose of statistical comparison and analysis. It is not intended to promote gambling or serve as betting advice. Please gamble responsibly and be aware of your local laws and age restrictions.
The betting odds are decimal (European) quotes: the figure is the total return per unit stake if the bet wins (stake included), so a probability \(p\) corresponds to fair decimal odds \(1/p\).2 I pulled outright winner prices from oddschecker.com 🗄️ and, for each player, used the best (highest) odds shown across the listed bookmakers.3 Simulation odds apply the same recipe to our simulated win percentages.
Here are the results. In the Difference column, a negative value means the market assigns shorter (more favourable) odds than the model; positive means the market is longer (more sceptical):
| Player | Elo | Simulation | Simulation odds | Betting odds | Difference |
|---|---|---|---|---|---|
| Zhao Xintong | 817.4 | 28.9% | 3.46 | 3.4 | −0.06 |
| Judd Trump | 768.3 | 18.73% | 5.34 | 7.0 | 1.66 |
| John Higgins | 696.9 | 7.83% | 12.77 | 31.0 | 18.23 |
| Wu Yize | 674.6 | 6.23% | 16.05 | 23.0 | 6.95 |
| Zhou Yuelong | 663.5 | 4.59% | 21.78 | 186.0 | 164.22 |
| Barry Hawkins | 621.5 | 4.48% | 22.32 | 49.0 | 26.68 |
| Kyren Wilson | 641.7 | 3.84% | 26.02 | 15.2 | −10.82 |
| Ronnie O’Sullivan | 631.7 | 3.77% | 26.49 | 8.45 | −18.04 |
| Mark Allen | 628.8 | 3.07% | 32.59 | 49.0 | 16.41 |
| Mark Selby | 629.0 | 3.01% | 33.24 | 11.0 | −22.24 |
| Shaun Murphy | 610.4 | 2.37% | 42.17 | 26.0 | −16.17 |
| Neil Robertson | 583.8 | 2.08% | 47.99 | 27.0 | −20.99 |
| Zhang Anda | 584.9 | 1.43% | 70.13 | 59.0 | −11.13 |
| Ali Carter | 585.2 | 1.29% | 77.29 | 147.0 | 69.71 |
| Stan Moody | 566.9 | 1.04% | 96.45 | 186.0 | 89.55 |
| Xiao Guodong | 574.9 | 1.01% | 98.71 | 108.0 | 9.29 |
| Mark Williams | 526.5 | 0.96% | 104.54 | 45.0 | −59.54 |
| Ding Junhui | 535.4 | 0.66% | 150.40 | 147.0 | −3.40 |
| Hossein Vafaei | 530.4 | 0.60% | 165.48 | 235.0 | 69.52 |
| Liam Pullen | 504.5 | 0.51% | 194.87 | 519.0 | 324.13 |
| Jak Jones | 531.2 | 0.49% | 204.09 | 74.0 | −130.09 |
| Gary Wilson | 534.1 | 0.49% | 206.12 | 186.0 | −20.12 |
| Pang Junxu | 504.4 | 0.46% | 218.67 | 549.0 | 330.33 |
| Chris Wakelin | 496.8 | 0.44% | 226.91 | 98.0 | −128.91 |
| Liam Highfield | 529.8 | 0.42% | 239.93 | 872.0 | 632.07 |
| Si Jiahui | 507.7 | 0.38% | 262.40 | 147.0 | −115.40 |
| Lei Peifan | 492.3 | 0.23% | 444.03 | 510.0 | 65.97 |
| David Gilbert | 479.7 | 0.21% | 486.95 | 186.0 | −300.95 |
| Fan Zhengyi | 482.1 | 0.19% | 527.12 | 745.0 | 217.88 |
| He Guoqiang | 467.1 | 0.16% | 638.65 | 617.0 | −21.65 |
| Matthew Stevens | 406.9 | 0.07% | 1514.00 | 617.0 | −897.00 |
| Antoni Kowalski | 399.7 | 0.06% | 1605.65 | 843.0 | −762.65 |
Model and market
The headline this year is that model and market agree on the favourite. Zhao Xintong’s simulation odds of 3.46 sit almost exactly on the best available betting price of 3.4. When serious maths and serious money converge on the same answer, it’s worth paying attention — and it’s a welcome change from last year’s more fractious disagreements.
The most persistent disagreement continues to involve Ronnie O’Sullivan. Our model now puts him at 3.77% (simulation odds 26.49); the market has him as third favourite at 8.45. Last year the gap was even more extreme: the model rated him last of 32 at odds of over 3,700, while bookmakers offered around 8.5 — almost exactly the same price as today. The market has consistently pegged Ronnie as a genuine Crucible contender regardless of recent results, and last year they were clearly right to do so. It’s hard to argue with a seven-time world champion’s track record at Sheffield.
The reverse problem afflicts Zhou Yuelong: simulation odds of 21.78, betting odds of 186 — the largest positive gap in the table at +164. The model rates him fifth in the world and gives him a favourable draw path; the market is barely interested. Whether that reflects genuine scepticism about his big-match temperament or simply unfamiliarity outside the circuit, something is being priced very differently by our two forecasters.
Mark Selby (simulation 33.24, market 11.0), Kyren Wilson (26.02, 15.2), Shaun Murphy (42.17, 26.0), and Neil Robertson (47.99, 27.0) all attract considerably more money than the model suggests. This is a consistent pattern across both years: established Crucible performers carry a premium that pure Elo doesn’t price in. The one-table arena, long match formats, and Sheffield’s unique atmosphere tend to favour experience and composure over raw recent form.
Final frame 🎱
The draw is set, the baize is freshly ironed, and for once the maths and the money agree: Zhao Xintong is the man to beat. We’ll know on May 4 whether the simulations hold up better in 2026 than they did in 2025 — or whether another name we’ve underrated is already plotting his way to the title.
All code and data remain available on GitLab.
As the dataset grows, the optimal \(K\) shifts slightly. With one more year’s data the optimiser now returns 44.6 rather than 42 — a small change that has no material effect on the rankings or predictions. ↩︎
There are different ways to quote odds. The one I’m using for this article is called the decimal or European style, which most easily translates to probabilities. The fractional or British style (which is more common in snooker bets for obvious reasons) quotes the potential win as a fraction. E.g., decimal odds of 5.00 would be quoted as 4/1 (or simply 4) in fractional style. ↩︎
Note that I’ve only used the highest odds offered by any broker. If you were to place a bet, you’d always want to go with the provider who offers you the highest payout, so that number is the most relevant. It’s also worth pointing out that when you sum up the probabilities implied by the odds, they will usually exceed 100%. That’s because the odds are slightly shorter than fair value — the bookmaker takes their cut (also known as vigorish). Remember: the house always wins. ↩︎