Welcome to the Crucible
This blog is usually all about board games, but let’s stretch the definition just a little: snooker is, after all, one of the most widely followed tabletop games in the world. And with the World Championship kicking off at the Crucible Theatre in Sheffield, I couldn’t resist the excuse to dive into something a bit different.
In the last article, we looked at how Elo ratings can be used to measure player strength over time. This time, we’ll take it a step further: using historical match data, a bit of Python, and a lot of simulated tournaments, we’ll try to predict who’s most likely to lift the trophy this year. We’ll also compare our predictions to what the betting markets say – and see whether the wisdom of the crowd agrees with the cold logic of the model.
Building the model: Elo meets the baize
Decades of data
So, let’s break off and finally calculate some Elo ratings. For this, snooker.org kindly provided data of 68,260 matches from 2,163 events contested by 4,212 players, ranging from 1975 till last Wednesday, via their API. I’ve included as many matches as I could find, regardless of tour, ranking status or eligible player group, as long as they weren’t team matches nor had any kind of inconsistency. For Elo calculations, it’s important to sequence matches correctly, and some matches in the database weren’t correctly labelled, but I did my best to get as clear data as possible. Note that I did not take frame score into account, but only cared about win/loss: since the match is stopped after a player reached the winning score and dead frames aren’t played out, the exact scoreline has little bearing on predictions.1
How Elo predicts the winners
To recap the actual calculations: all players start at an Elo rating of 0. (As mentioned before, it really could be any value, but we’ll stick with the simplest one.) Using the ratings \(r_A\) and \(r_B\) before the match, we can predict A’s win probability \(p_A\) like this:
\[ p_A = \frac{1}{1 + 10^{-(r_A - r_B) / 400}}. \]
As usual, we can calculate B’s chances via \(p_B=1-p_A\), so we won’t need to worry much about that. Once the match is done, we can compare that prediction with the actual outcome \(s_A\), where we score a win as 1 and a loss as 0. We then update A’s rating:
\[ r_A \leftarrow r_A + K (s_A - p_A), \]
where \(K\) is the update factor I’ve set to 42 for the purpose of this exercise since it’s the value that yields the most accurate predictions.2 (Much more on this in the next article.)
Match by match: how ratings shift
Let’s look at some examples. Before the very first match in the database, Ray Reardon vs John Spencer on 1975-01-17, we didn’t know anything about any player, so they all had the initial rating of 0. If you plug a rating difference of 0 into the formula, you’ll see that we predict even chances of winning for both players (which makes perfect sense). John Spencer won that match, so we updated
\[ r_{\text{JS}} \leftarrow 0 + 42 \cdot (1 - 0.5) = 21. \]
His opponent got his rating reduced by the same amount3: \(r_{\text{RR}}\leftarrow-21\). I wrote a simple Python script to carry out these calculations for all 68,259 matches that followed.
Let’s take a look at one more match: the final of the most recent tournament, the 2025 Tour Championship, played between snooker legends John Higgins and Mark Selby, both with four world titles to their name. They went into the match with Elo ratings of 718.3 and 714.5, respectively. This means we would’ve predicted Higgins’ win probability to be 50.5%. The match was indeed won by John Higgins, who gained \(42\cdot(1-0.505)=20.8\) points, whilst Mark Selby lost the same amount, for a new (and current) rating of 739.0 and 693.7, respectively.
Who’s on top? Elo’s current kings
As mentioned, my code diligently carried out the Elo predictions and updates for every single match from 1975 till the 2025 World Championship Qualifiers earlier this week. These are the ten currently highest rated player:
| Rank | Name | Elo | Matches | First match |
|---|---|---|---|---|
| 1 | John Higgins | 739.0 | 1436 | 1992-10-25 |
| 2 | Judd Trump | 709.2 | 1407 | 2005-11-03 |
| 3 | Kyren Wilson | 695.9 | 1055 | 2010-06-27 |
| 4 | Mark Selby | 693.7 | 1446 | 1999-10-24 |
| 5 | Zhao Xintong | 687.6 | 424 | 2012-06-18 |
| 6 | Joe O’Connor | 646.7 | 367 | 2012-09-05 |
| 7 | Barry Hawkins | 641.1 | 1153 | 1997-03-25 |
| 8 | Neil Robertson | 624.1 | 1236 | 1999-03-20 |
| 9 | Shaun Murphy | 606.9 | 1225 | 2001-02-11 |
| 10 | Ali Carter | 605.2 | 1194 | 1997-03-25 |
By winning the 2025 Tour Championship, John Higgins claimed back the top spot he first held after winning his maiden world title in 1998. The list mostly contains consistently successful players over the past decades, as well as more recently rising stars like Zhao Xintong and Joe O’Connor.
Rising stars and fading legends
It’s fun to look back in time and check how players’ ratings evolved over time: Who was the highest rated player of his time? When did his ratings rise and fall? Let’s take a look across the decades:

The 1980’s we undoubtably Steve Davis’ years, who won six world championships. The only way was up for him. It’s also noteworthy how teenager Stephen Hendry rose to prominence.

Just as Steve Davis dominated the 80’s, Stephen Hendry dominated the next decade, winning seven of the ten world championships. The plot also quite clearly shows the change in generations when John Higgins, the first of the “Class of ‘92”, overtook Stephen Hendry in 1998.

The first decade in the new millennium was strongly influenced by the other two members of the “Class of ‘92”: Ronnie O’Sullivan and Mark Williams.

Maybe the first thing you’ll notice in the 2010’s is how much more often the ratings change, reflecting a notable increase in tournaments. Mark Selby won three world titles in this decade.
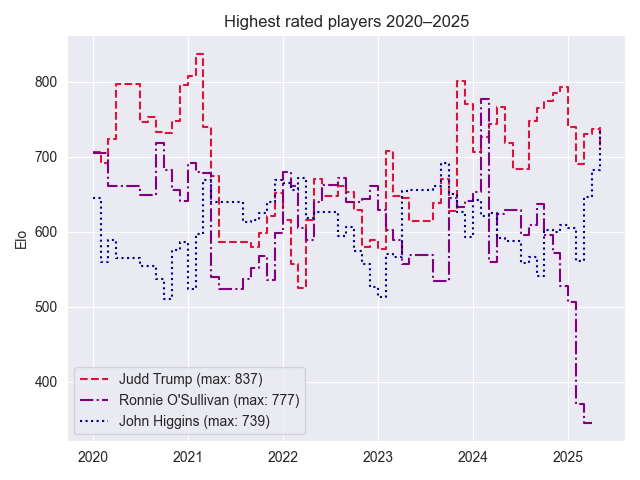
Judd Trump won more titles than any other player in recent years, reaching an all time high Elo rating of 837 in February 2021, though notably he’s been struggling with the long distances during the World Championship, “only” winning one so far in 2019.
You might also notice how Ronnie O’Sullivan sharply dropped recently in his rating. This is because he lost a couple of matches in his last tournament and then withdrew from the next, which are counted as losses in my code. (If you’ve ever played games online you’ll agree that players who rage quit should still suffer the full Elo penalty.) Still, he’s the most successful player of all times and has been rated highest for a total of 9.5 years, longer than anybody else.
Here’s the top 10 of the players who spent the most time at the top spot:
| Name | Months | First | Last |
|---|---|---|---|
| Ronnie O’Sullivan | 114 | 1998-03-01 | 2024-02-01 |
| Steve Davis | 97 | 1981-05-01 | 1990-10-01 |
| Stephen Hendry | 91 | 1990-11-01 | 2006-01-01 |
| John Higgins | 61 | 1998-06-01 | 2025-05-01 |
| Ray Reardon | 44 | 1976-02-01 | 1983-05-01 |
| Judd Trump | 44 | 2012-01-01 | 2025-04-01 |
| Mark Williams | 34 | 2000-06-01 | 2021-11-01 |
| John Spencer | 24 | 1975-02-01 | 1978-04-01 |
| Neil Robertson | 18 | 2011-11-01 | 2023-01-01 |
| Cliff Thorburn | 10 | 1985-03-01 | 1986-10-01 |
Obviously, it was much easier to remain highest rated for a long time when there were much fewer events per year, but I do believe this list is a pretty representative hall of fame of snooker players.
One final comment on the historical view of Elo ratings: you might have noticed that the values have generally increased over time. There’s a number of factors at play – mostly the fact that there are a lot more players and matches these days, which give the top players more opportunities to collect points from weaker opponents. Remember that we chose \(K\) such that it the Elo system would have the best predictive power. Since the vast majority of the matches in the dataset were played in the last two decades or so, the ratings are tuned with a strong recency bias. Interpret historical Elo ratings with caution and remember that Elo is most descriptive within an active community of players.
10 Million Tournaments Later…
I thought it would be a fun application to use those Elo ratings we calculated to predict who will win the current World Championship. For this, I’ve run a bunch of simulated tournaments. The idea is quite simple: for each of the first round pairings in the draw, I compare the current Elo ratings of those two players, convert them into a win probability as described above, and toss a virtual coin in order to determine who proceeds to the second round. We apply the same principle to that and all the following rounds, until the final coin for the final is tossed and the winner of that simulation run is determined. I’ve run a total of 10 million simulated tournaments and counted how often each player won a simulation. Here are the results:
| Player | Elo | Simulation probability |
|---|---|---|
| John Higgins | 739.1 | 13.14% |
| Judd Trump | 709.3 | 12.63% |
| Mark Selby | 693.8 | 12.59% |
| Zhao Xintong | 687.7 | 10.58% |
| Kyren Wilson | 695.9 | 9.56% |
| Ali Carter | 605.3 | 5.20% |
| Neil Robertson | 624.2 | 4.74% |
| Barry Hawkins | 641.2 | 4.45% |
| Shaun Murphy | 607.0 | 3.52% |
| Joe O’Connor | 646.8 | 3.51% |
| Xiao Guodong | 601.5 | 2.27% |
| Hossein Vafaei | 600.4 | 2.26% |
| Wu Yize | 579.1 | 2.05% |
| David Gilbert | 544.4 | 1.53% |
| Zak Surety | 552.3 | 1.45% |
| Mark Allen | 551.2 | 1.39% |
| Ding Junhui | 549.3 | 1.36% |
| Pang Junxu | 528.0 | 1.34% |
| Ryan Day | 535.8 | 1.11% |
| Luca Brecel | 525.0 | 0.90% |
| Zhou Yuelong | 539.7 | 0.82% |
| Matthew Selt | 545.6 | 0.79% |
| Lei Peifan | 534.1 | 0.64% |
| Fan Zhengyi | 508.5 | 0.60% |
| Ben Woollaston | 490.1 | 0.42% |
| Chris Wakelin | 476.1 | 0.30% |
| Mark Williams | 470.7 | 0.23% |
| Si Jiahui | 445.5 | 0.21% |
| Daniel Wells | 458.3 | 0.19% |
| Zhang Anda | 427.4 | 0.17% |
| Jak Jones | 379.3 | 0.03% |
| Ronnie O’Sullivan | 345.2 | 0.03% |
Unsurprisingly, the order strongly correlated with the Elo ranking we’ve seen above, but it’s not quite the same. E.g., defending champion Kyren Wilson is the third highest rated player according to Elo, but only fifth favourite to win the tournament again. How come? The answer is that there are easier and harder paths to the final. Kyren Wilson faces the relatively highly rated Lei Peifan in the first round, whilst the two players which overtook him, Mark Selby and Zhao Xintong, face the relatively lowly rated Ben Woollaston and Jak Jones, respectively.
Let’s make some money with this knowledge, shall we? 💸
How does the market compare? Bookies vs model
Disclaimer: This section discusses betting odds for the purpose of statistical comparison and analysis. It is not intended to promote gambling or serve as betting advice. Please gamble responsibly and be aware of your local laws and age restrictions.
I’m personally not the gambling kind and wouldn’t advice you to pick up that addictive habit either. But sport bets are an undeniably interesting data source for predictions, as you really need to put your money where your mouth is. That’s why you often see betting odds discussed ahead of big sporting events: there’s few models with comparable predictive accuracy. So I thought it’s an interesting reality check for those simulations to compare those results to what gamblers are willing to bet on the snooker stars.
First, we need briefly discuss how to convert those probabilities to odds. Let’s say I offer you the following gamble: you pay me €1, then I toss a (fair) coin. Heads: I pay you back €2; tails: I keep your money. You probably intuitively know that the expected payout is €1, so you can take or leave the bet and wouldn’t be better or worse off for it. Had I offered you a potential win of €2.10, you actually should take the bet; for a €1.90 stake you should definitely pass.
The same basic idea applies to the odds quoted4 in sport betting: The broker will quote odds like 5, meaning I could win €5 if I bet €1 (for a potential gain of €4). If I believe the event will occur with a 20% probability, my expected payout is exactly 1 – I should only take the bet if my belief in that event is higher (if you must take the bet at all). In other words: in order to convert between probabilities and odds, you just take the reciprocal. E.g., the win probability of 13.14% for John Higgins corresponds to odds of \(1/0.1314=7.61\), i.e., I’d expect to make money if someone offered longer odds and might be inclined to take the bet.
So, I’ve taken a look at oddschecker.com 🗄️ to see what odds different brokers offer for different players to win the World Championship. These are the odds5 as offered and how they compare to the odds implied by our simulations:
| Player | Simulation odds | Betting odds | Difference |
|---|---|---|---|
| John Higgins | 7.61 | 16.20 | 8.59 |
| Judd Trump | 7.92 | 5.12 | -2.80 |
| Mark Selby | 7.94 | 6.50 | -1.44 |
| Zhao Xintong | 9.45 | 17.00 | 7.55 |
| Kyren Wilson | 10.46 | 10.30 | -0.16 |
| Ali Carter | 19.24 | 137.00 | 117.76 |
| Neil Robertson | 21.08 | 17.00 | -4.08 |
| Barry Hawkins | 22.48 | 29.00 | 6.52 |
| Shaun Murphy | 28.41 | 26.00 | -2.41 |
| Joe O’Connor | 28.48 | 69.00 | 40.52 |
| Xiao Guodong | 43.98 | 88.00 | 44.02 |
| Hossein Vafaei | 44.24 | 225.00 | 180.76 |
| Wu Yize | 48.84 | 64.00 | 15.16 |
| David Gilbert | 65.32 | 167.00 | 101.68 |
| Zak Surety | 69.14 | 265.00 | 195.86 |
| Mark Allen | 72.02 | 25.00 | -47.02 |
| Ding Junhui | 73.62 | 41.00 | -32.62 |
| Pang Junxu | 74.79 | 126.00 | 51.21 |
| Ryan Day | 89.73 | 490.00 | 400.27 |
| Luca Brecel | 111.24 | 54.00 | -57.24 |
| Zhou Yuelong | 121.72 | 314.00 | 192.28 |
| Matthew Selt | 126.09 | 598.00 | 471.91 |
| Lei Peifan | 156.10 | 470.00 | 313.90 |
| Fan Zhengyi | 166.10 | 323.00 | 156.90 |
| Ben Woollaston | 237.23 | 843.00 | 605.77 |
| Chris Wakelin | 337.92 | 235.00 | -102.92 |
| Mark Williams | 436.80 | 64.00 | -372.80 |
| Si Jiahui | 485.60 | 54.00 | -431.60 |
| Daniel Wells | 516.10 | 980.00 | 463.90 |
| Zhang Anda | 587.96 | 83.00 | -504.96 |
| Jak Jones | 3642.99 | 127.00 | -3515.99 |
| Ronnie O’Sullivan | 3703.70 | 8.50 | -3695.20 |
I’d say, by and large those match quite well. Clearly, “the market” believes more in some players than our model, but the ballpark is right, at least for the highest rated players. (Low probabilities correspond to huge odds, which brokers rarely are willing to offer.) The most notable exception is Ronnie O’Sullivan: as discussed before, our model rates him lowest amongst all participants, but he’s still one of the favourites to win according to the bookmakers – even though he hadn’t even confirmed his participation until a day before the opening match.
I wouldn’t bet my money on him, but as I said: I’m not the gambling kind. 🤷
Final frame 🎱
I hope I made up for the absence of concrete examples from the last article. I’m certainly more excited than ever for 17 days of world class snooker. We’ll see on May 5th if my predictions were worth anything.
The next Elo article will finally drill deeper into the often teased nuances of choosing \(K\) correctly. We’ll then use this knowledge to exactly quantify what’s the ratio between luck and skills in games. It’ll get properly scientific! 🧑🔬
As always, you can find all the code for the simulations etc from GitLab.
There’s a number of different decisions one needs to make for such a system, e.g., what matches to include, how to score them, the ubiquitous choice of \(K\), etc. If you want to compare my results with a different approach, take a look at snooker-predictions.com. ↩︎
Seriously, it’s not a Douglas Adams reference. The maths just worked out that way. ↩︎
Because we applied Elo’s formula in its simplest form, all updates will be zero-sum, and the overall average Elo rating will stay fixed at 0. ↩︎
There are different ways to quote odds. The one I’m using for this article is called the decimal or European style, which most easily translates to probabilities. The fractional or British style (which is more common in snooker bets for obvious reasons) quotes the potential win as a fraction. E.g., decimal odds of 5.00 would be quoted as 4/1 (or simply 4) in fractional style. ↩︎
Note that I’ve only used the highest odds offered by any broker. If you were to place a bet, you’d always want to go with the provider who offers you the highest payout, so that number is the most relevant. It’s also worth pointing out that when you sum up the probabilities implied by the odds, they will usually exceed 100%. That’s because the odds are slightly shorter than they should be because the brooker wants their cut (also know as vigorish) too. Remember: the house always wins. ↩︎