🇪🇸 Spain won. 🏆
I called it in part 2c, back in June, at 35.3% — the model’s boldest, most market-contrarian pick of this whole series. Two and a half weeks later, in part 2d, I was explaining why the model had changed its mind and put 🇦🇷 Argentina in front instead. The trophy is now in Madrid anyway. This is the piece I promised on the day the series started: grading the homework, in full, now that there’s nothing left to simulate.
The whole tournament, one chart
Every market_comparison.csv this project ever wrote is sitting in Git history, so instead of describing the arc from memory I went and reconstructed it — 42 forecast snapshots, pre-tournament through the final whistle, tracking the model’s own title probability for the teams that mattered most.
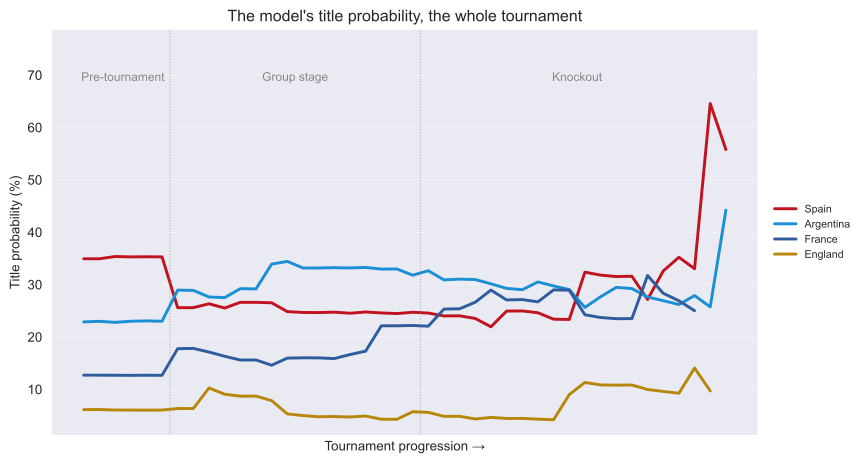
The numbers, at the three moments that count:
| Team | Pre-tournament | Post-group stage | Result |
|---|---|---|---|
| 🇪🇸 Spain | 35.3% | 24.7% | Champions |
| 🇦🇷 Argentina | 23.0% | 31.8% | Runners-up |
| 🇫🇷 France | 12.7% | 22.2% | Lost in the semi-final |
| 🏴 England | 6.0% | 5.7% | Lost in the semi-final |
🇦🇷 Argentina’s 31.8% wasn’t a blip — it held up as the model’s top pick through the entire group stage and Round of 32, and most of the Round of 16 besides. The lead flipped back to 🇪🇸 Spain at one specific moment: their Round-of-16 win over 🇵🇹 Portugal, which sent 🇪🇸 Spain from the low-20s to 32.4% in a single update. 🇦🇷 Argentina never regained top spot. Then the semi-final win over 🇫🇷 France sent 🇪🇸 Spain’s number past 50%, and it stayed there for the final. The model’s very first instinct from June — 🇪🇸 Spain, comfortably — turned out to be right. It just took a three-week detour through being wrong to get there.
Grading the knockout stage
Thirty-one modelled knockout matches, from the Round of 32 to the final itself.1 The model picked the correct winner in 26 of them — 83.9%. It’s more demanding to ask for the actual scoreline: the model’s top-5 most-likely scores for a fixture contained the real result 21 times out of 31 — 67.7%.
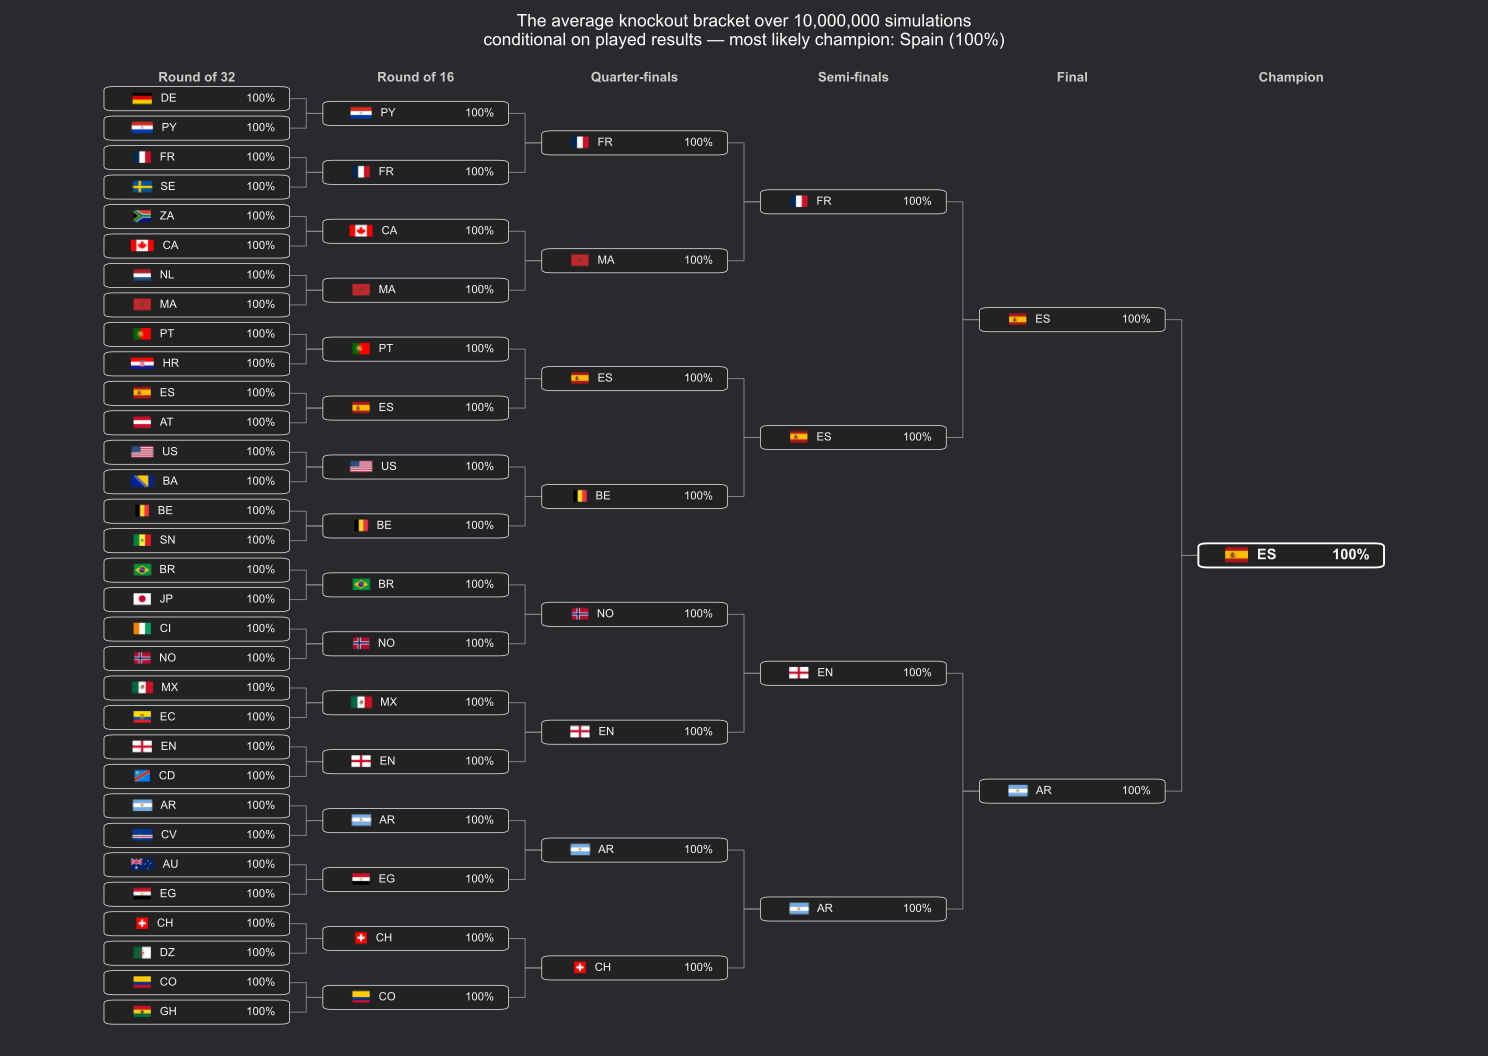
Five matches went against the model’s pick:
| Match | Model favoured | Probability | Actual winner |
|---|---|---|---|
| R32 — Germany vs Paraguay | 🇩🇪 Germany | 66.5% | 🇵🇾 Paraguay |
| R32 — Netherlands vs Morocco | 🇳🇱 Netherlands | 62.5% | 🇲🇦 Morocco |
| R32 — Australia vs Egypt | 🇦🇺 Australia | 59.5% | 🇪🇬 Egypt |
| R16 — Brazil vs Norway | 🇧🇷 Brazil | 57.6% | 🇳🇴 Norway |
| R16 — Switzerland vs Colombia | 🇨🇴 Colombia | 63.3% | 🇨🇭 Switzerland |
None of the five is a blowout misprediction — every losing favourite sat somewhere in a 57.6%–66.5% band, never the 80%+ territory that would mean the model got genuinely fooled. That’s roughly what a well-calibrated forecaster should produce over thirty-one matches: a model that never got a 60/40 call wrong would be overconfident, not accurate.
The literal penalty shootout
This series has been promising to call its finale “the penalty shootout” since part 2d, and the actual final — 1–0, settled in extra time — never needed one. But four knockout matches elsewhere in the bracket did, and the pattern is too clean to leave out: every single shootout of the tournament was won by the side Elo rated the underdog.2
| Match | 90-minute score | Model favoured | Shootout winner |
|---|---|---|---|
| 🇩🇪 Germany vs 🇵🇾 Paraguay | 1–1 | 🇩🇪 Germany (66.5%) | 🇵🇾 Paraguay |
| 🇳🇱 Netherlands vs 🇲🇦 Morocco | 1–1 | 🇳🇱 Netherlands (62.5%) | 🇲🇦 Morocco |
| 🇦🇺 Australia vs 🇪🇬 Egypt | 1–1 | 🇦🇺 Australia (59.5%) | 🇪🇬 Egypt |
| 🇨🇴 Colombia vs 🇨🇭 Switzerland | 0–0 | 🇨🇴 Colombia (63.3%) | 🇨🇭 Switzerland |
Four for four. The simulator, as documented back in part 2c, doesn’t model penalties as their own event — level knockout matches resolve on the same Elo-implied coin as the rest of the tie. That’s an honest modelling choice, not a hedge, and this year the coin landed on the underdog every time it was actually flipped for real. Small sample, and I wouldn’t bet on the pattern repeating — but for a series that promised you a penalty shootout, this is the closest the data gets to delivering one.
Model vs market: who won the argument
Disclaimer: This section discusses betting odds for the purpose of statistical comparison and analysis. It is not intended to promote gambling or serve as betting advice. Please gamble responsibly and be aware of your local laws and age restrictions.
The spine of part 2c was a single number: 🇪🇸 Spain’s +19.3pp edge over Polymarket, the strongest model-vs-market disagreement this blog had ever published. Part 2d found it had shrunk to +14.2pp as both sides moved toward each other. Here’s the full arc — model’s title probability minus the market’s, for the same four teams, over the same 42 snapshots:
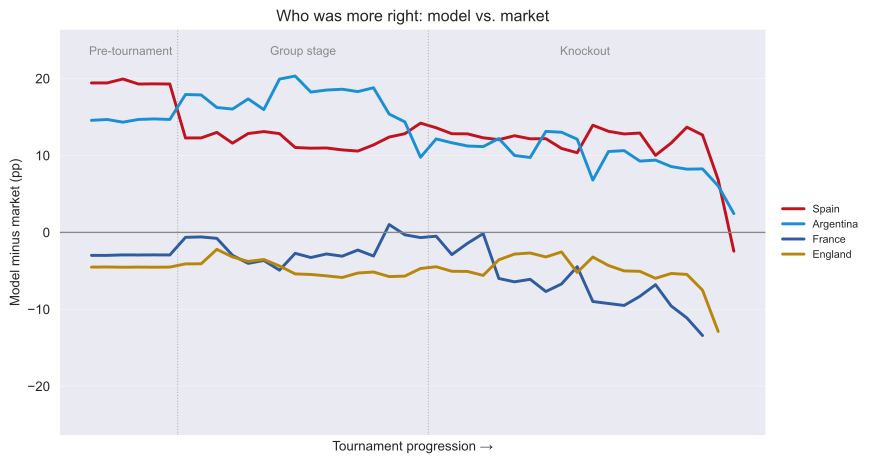
🇪🇸 Spain and 🇦🇷 Argentina sit above the zero line for almost the entire tournament — the model liked both more than the market did, from the very first snapshot to deep into the knockout stage. 🏴 England and 🇫🇷 France sit below it almost as consistently — the market was the more optimistic side on both of them, and stayed that way as 🇫🇷 France’s own run to the semi-final pulled its market price up faster than the model’s. The numbers at the three moments this series called out:
| Snapshot | Model | Market | Edge |
|---|---|---|---|
| Pre-tournament | 35.3% | 16.0% | +19.3pp |
| Post-group stage | 24.7% | 10.5% | +14.2pp |
| Eve of the final | 55.8% | 58.2% | −2.4pp |
By kickoff of the final, the argument had not just closed — it had flipped. The market ended up more confident in 🇪🇸 Spain than the model was. The +19.3pp headline that opened this series didn’t survive contact with three months of actual football, but the side of it that turned out closer to reality — “🇪🇸 Spain, undervalued” — was the model’s, all along.
One for the historians
🇪🇸 Spain’s women won the World Cup in 2023, and the men’s side already had one from 2010 — which already made them the second nation ever, after 🇩🇪 Germany, to hold titles on both sides. What 2026 adds is the rarer thing: because 🇪🇸 Spain’s women are still the reigning champions when the men lift this trophy, 🇪🇸 Spain becomes the first nation in history to hold both titles at the same time. 🇩🇪 Germany has won both — four men’s titles, two women’s — but never in the same window: their last men’s title (2014) came seven years after their last women’s title (2007), by which point the women’s crown had already passed to Japan.
And going into 2030 — hosted jointly by 🇪🇸 Spain, 🇵🇹 Portugal and 🇲🇦 Morocco, with three centenary matches in 🇺🇾 Uruguay, 🇦🇷 Argentina and 🇵🇾 Paraguay — 🇪🇸 Spain will be the first host nation in men’s World Cup history to enter as the defending champion. No prior host has ever managed it — hosts are picked years ahead of time, the championship changes every four years, and the two have simply never lined up before now. The women’s side got there first, twice, and it hasn’t gone well either time. The 🇺🇸 USA were reigning champions from 1999 when they hosted 2003 — and lost the final to 🇩🇪 Germany. 🇩🇪 Germany then won again in 2007, hosted 2011 as two-time defending champions — and lost in the quarter-final. Two attempts, two defending-champion hosts, zero repeat titles. Maybe a bad omen for 🇪🇸 Spain in 2030.
Last thing, because it’s the best line of the whole tournament and nowhere else in this piece fits it: the bronze medal match, 🇫🇷 France 4–6 🏴 England, is the highest-scoring third-place game in World Cup history, beating 🇫🇷 France’s own 6–3 win over 🇩🇪 West Germany in 1958. Bukayo Saka scored a hat-trick. It’s 🏴 England’s best World Cup finish since they won the whole thing in 1966 — and it isn’t even the headline of their tournament.
Final whistle ⚽
Three articles, ten million simulations each time the bracket reshuffled, and a model that spent the middle third of the tournament confidently backing the wrong finalist before its very first instinct turned out to be the right one. 🇪🇸 Spain are champions, 83.9% of the knockout bracket went the way the model said it would, and the +19.3pp argument that started this series ended up inverted by the time it mattered. That’s a good outcome for a rating system: not infallible, not embarrassed, just — mostly right, for reasons that shifted under it the whole way through.
Thanks for reading along since June. See you for the next 48-team fever dream in 2030.
All the code, data snapshots and figures for this article live on GitLab. The full match-by-match grading table is here; the full 42-snapshot trajectory data is here.
The bronze medal match sits outside the simulator’s structured pipeline — it isn’t part of the single-elimination bracket the model tracks — so it’s excluded from the 31-match grading and covered separately, below. ↩︎
“Underdog” here means the side the model gave less than 50% to win the tie inside 90 minutes; the shootout itself isn’t separately modelled, so this is a real-world coincidence the simulator has no mechanism to have predicted. ↩︎